![]()
![]()
![]()
![]()
![]()
![]()
![]()
![]()
![]()
![]()
![]()
![]()
![]()
![]()
![]()
![]()
![]()
![]()
![]()
![]()
![]()

mRNA secondary structure prediction
Dr. Hofacker (ivo@tbi.univie.ac.at) at the University of Vienna, Austria has shared his mRNA prediction software package called Vienna RNA Package (http://www.tbi.univie.ac.at/~ivo/RNA/). Visual Gene Developer adopted the package with his permission and developed a more versatile mRNA prediction engine whose class name is 'mRNApredict'. For more details about 'mRNApredict', check the 'Class & module' section on the left menu. Therefore, Visual Gene Developer calculates mRNA structure and Gibbs free energy exactly the same way as his website (RNAfold WebServer, http://rna.tbi.univie.ac.at/cgi-bin/RNAfold.cgi) does.
As additional features, Visual Gene Developer not only provides a user-friendly interface but also supports network computing and multi-thread computing, and the class (mRNApredict) can be used programmatically when a user develops modules. It means that the mRNA prediction results can be used as input data for other modules or classes. Check the 'Module development' or 'Class & module' section in the left menu for more details.
With regard to mRNA structure optimization, our goal is developing a fully automated optimization process to analyze mRNA secondary structure. For example, the predicted mRNA structure in itself doesn't say anything. To get important information, we have to investigate and analyze the shape of the predicted mRNA structure very carefully. Therefore, without developing an automated mRNA structure analyzer, we can't develop the fully automated gene optimization system. Due to this reason, Visual Gene Developer provides an essential class designated as 'mRNAanalyzer' to help users extract important parameters or features from the predicted mRNA secondary structure. Please check the 'Class & module' section on the left menu.
o How to predict mRNA secondary structure or Gibbs free energy
1. Click on the 'mRNA secondary structure' in the 'Analysis' menu.
2. The 'RNA structure' window will be pop-up
3. Paste sequence and then click on the 'Calculate mRNA' button. There are two methods: 'Only structure (fast)' and 'Heat and Probability (slow)'
In case of 'Only structure (fast)', although calculation speed is fast, it doesn't calculate heat and probability.
4. After showing a progress window, the 'mRNA structure viewer' window will be pop-up as shown in the figure.
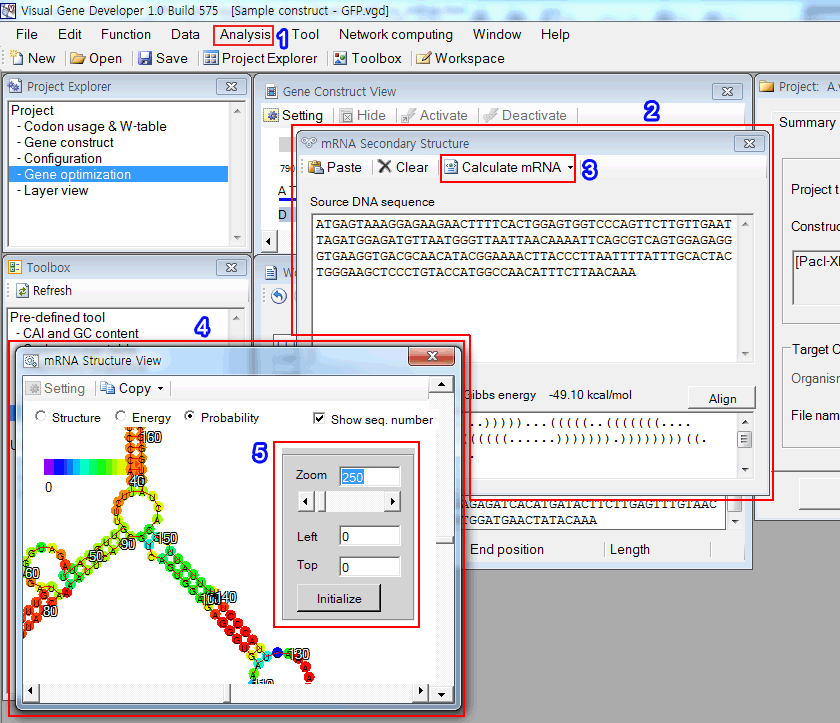
5. Click on the mouse right button to show the panel
o How to use 'mRNApredict' class for module development
1. Click on the 'Module Library' in the 'Tool' menu.
2. Choose 'mRNApredict'
3. Click on the 'Edit Module'
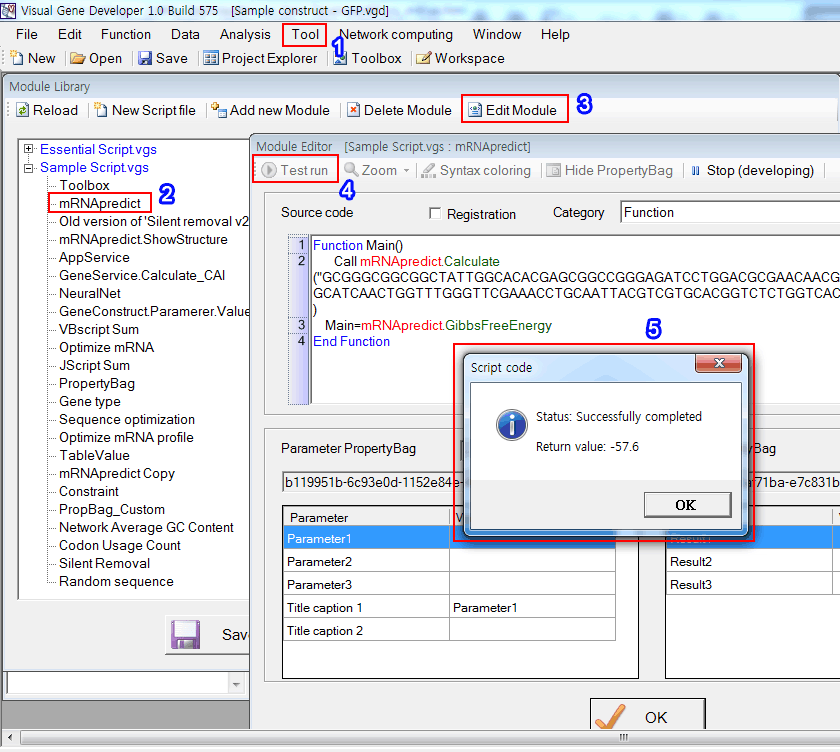
4. Click on the 'Test run' button
5. You can see the result. It is the Gibbes free energy of the given sequence in the source code.
o User-defined function in Toolbox
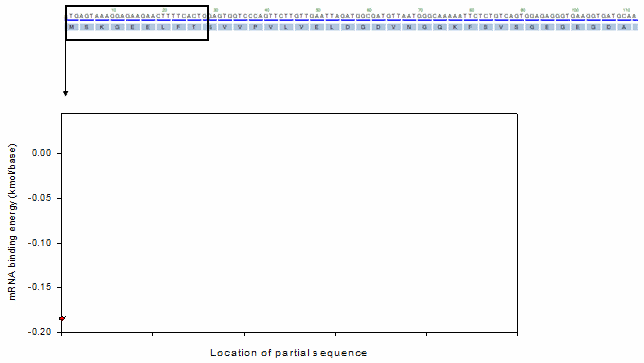
- mRNA profiling function
It analyzes mRNA secondary structures of all partial sequences of a test gene and then draws a plot or exports raw data to the clipboard. First, paste a test sequence to the 'Workspace' window. And then double-click on the 'mRNA profile v2' in the 'Toolbox' window. It will take several seconds to analyze the test sequence. A user also can modify the original VBScript source code to adjust parameters.
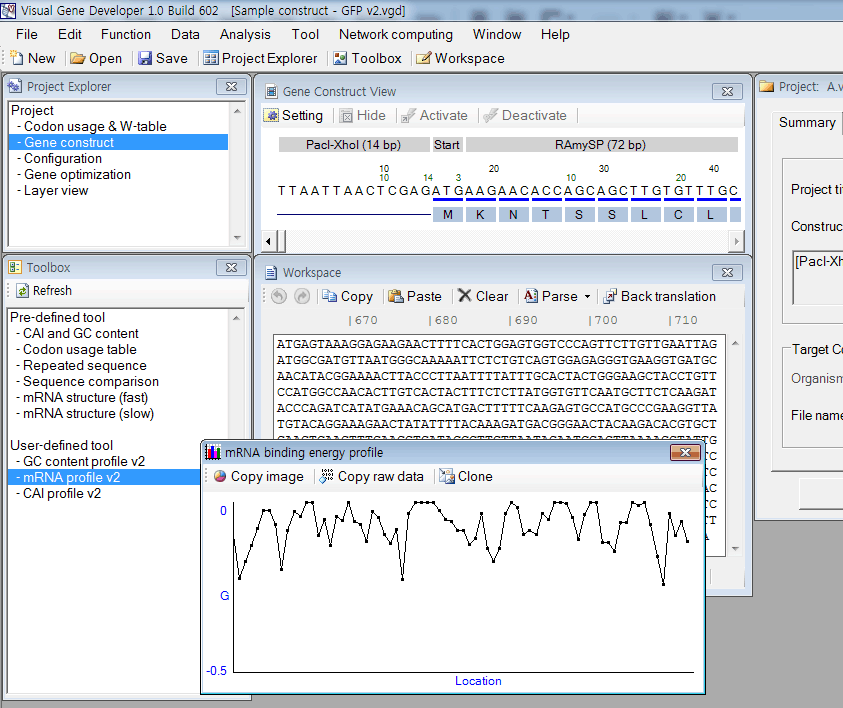
Or, a user can take raw data by clicking on 'Copy raw data' button in the 'mRNA binding energy profile' window. Then, a user may use drawing software such as SigmaPlot to plot the following exemplary figure.
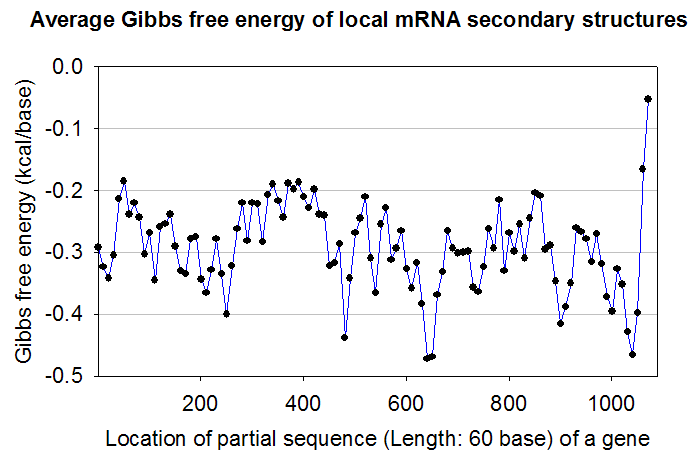
For the profiling function, a moving window method was adopted as shown in the following animation.
Source code (VBScript version)
mRNA profile v1 (w/o including graphic function)
|
Function Main() |
mRNA profile v2 (upgraded from mRNA profile v1. Graphic function added)
|
Function Main() '-------- Setting ------------------------------------------------------------------------------------------------------- Window_Size=30 'Length of partial test sequence Step_Size=9 'Interval between partial test sequences through entire sequence '------------------------------------------------------------------------------------------------------------------------
SourceSeq=AppService.Workspace_Value If SourceSeq="" then Exit Function End If SourceSeq_Length=Len(SourceSeq) Start_Position=1 End_Position=SourceSeq_Length
Buf_Str=""
'**** Graphics ********************** CustomUI.Define_Canvas 500,200 CustomUI.Form_BringToFront CustomUI.Clear_Canvas CustomUI.Form_Caption="mRNA binding energy profile" CustomUI.DrawLine 30,10,30,180,"Black" CustomUI.DrawLine 30,180,490,180,"Black" CustomUI.DrawString 15,95,"G","Blue" CustomUI.DrawString 250,180,"Location","Blue" CustomUI.DrawString 15,10,"0" CustomUI.DrawString 1,170,"-0.5" CustomUI.Set_ForeColor_byName "Black"
'*** Calculate mRNA Gibbs free energy ************************************************ For Current_Position=Start_Position to End_Position - Window_Size step Step_Size
AppService.InstantMsg "Calculating mRNA structure at " + CStr(Current_Position)
TestSeq=Mid(SourceSeq,Current_Position,Window_Size) TestSeq_Length=Len(TestSeq) Call mRNApredict.Calculate(TestSeq,True)
GibbsEnergy=mRNApredict.GibbsFreeEnergy()
X2=(Current_Position-Start_Position )/SourceSeq_Length*480+30 Y2=(-GibbsEnergy/TestSeq_Length)*170/0.5+10 If Current_Position>Start_Position Then CustomUI.DrawLine X1,Y1,X2,Y2 CustomUI.DrawRectangle X2-1,Y2-1,2,2 CustomUI.Update_Canvas End If X1=X2 Y1=Y2
Buf_Str=Buf_Str + CStr(Current_Position) + Chr(9) + CStr(GibbsEnergy/TestSeq_Length) + Chr(13) + Chr(10)
Next
CustomUI.RawData=Buf_Str CustomUI.Make_Clone
End Function |
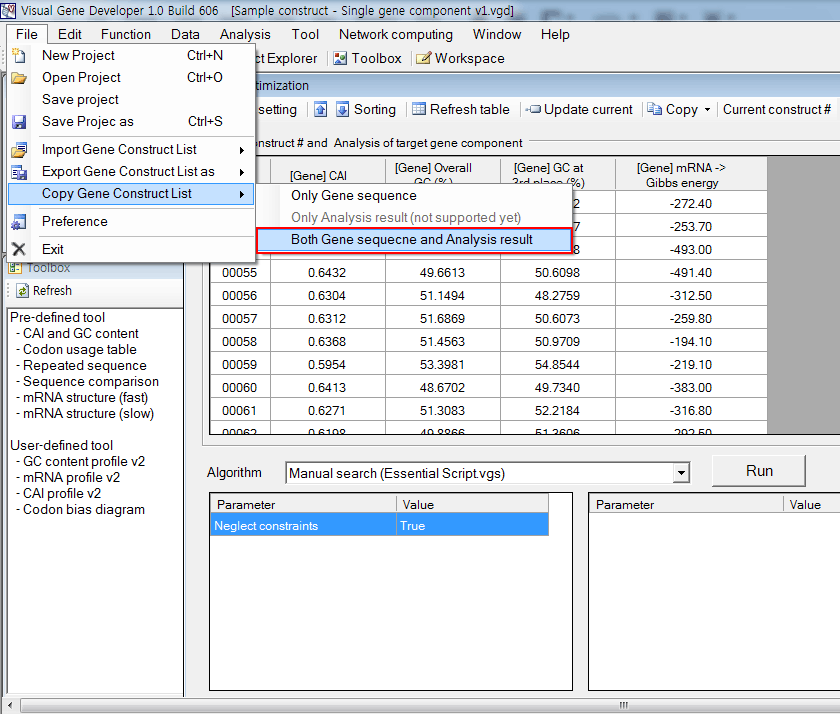
o Fast analysis of mRNA binding energy of multiple genes
using Network & multi-threaded computing function
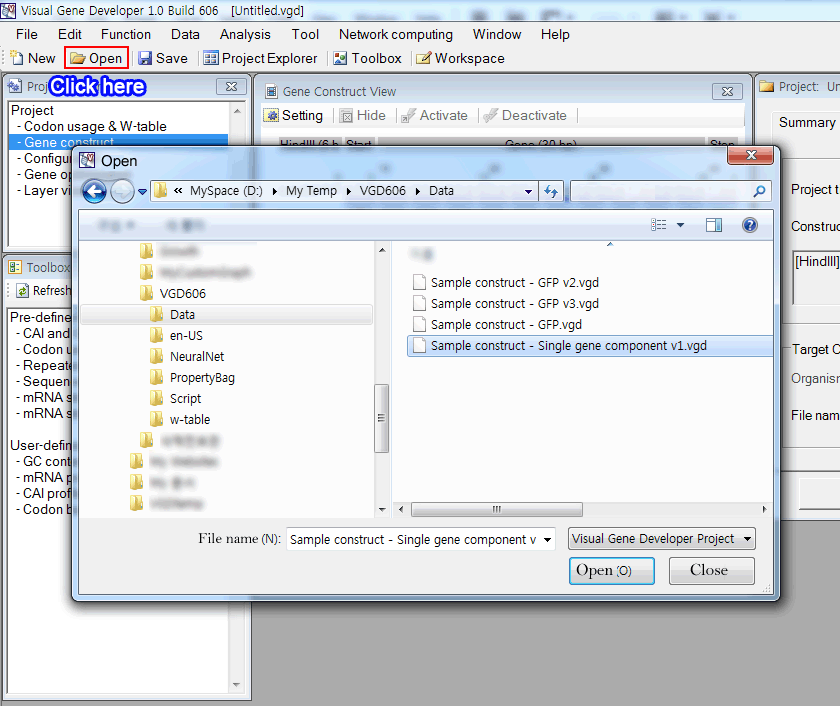
1. Open "Sample construct - Single gene component v1.vgd" Download (Save Link As)
The gene construct of the sample file consists of a single gene construct component.
Check by clicking on the 'Gene construct' button on the 'Project Explorer' window.
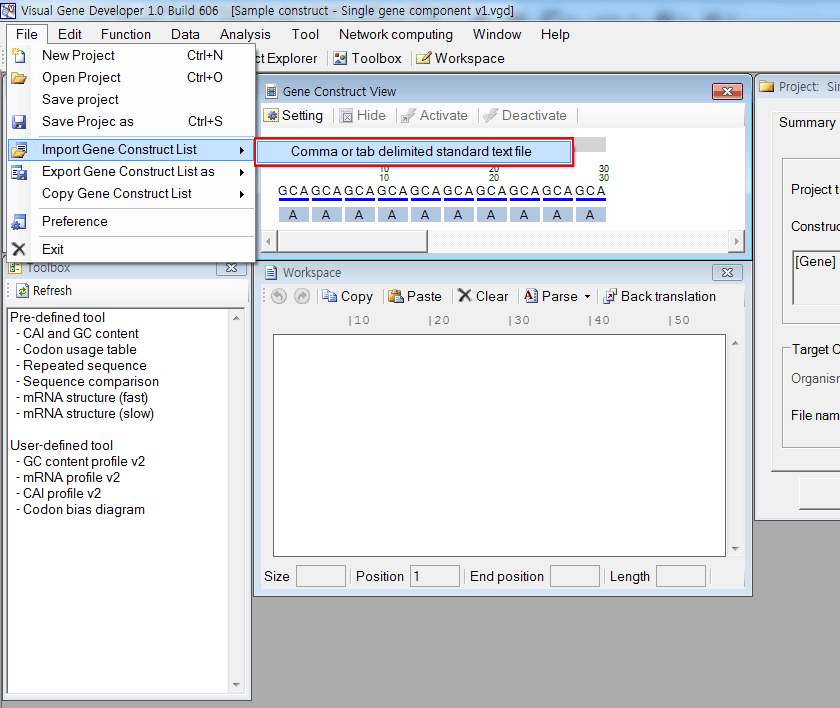
2. Import gene construct list text file named as "Sample Construct List 5 (1 element, 1000 constructs).txt" View or download (Save Link As)
The text file contains random 1000 gene sequences. You can check its content opening the file.
3. Click on the 'Gene optimization' button on the 'Project Explorer' button. You can see imported 1000 sequences and their analysis results.
Or, you can click on the 'Gene optimization' button on the 'Project Explorer' button before importing the gene construct list file to check real-time analysis.
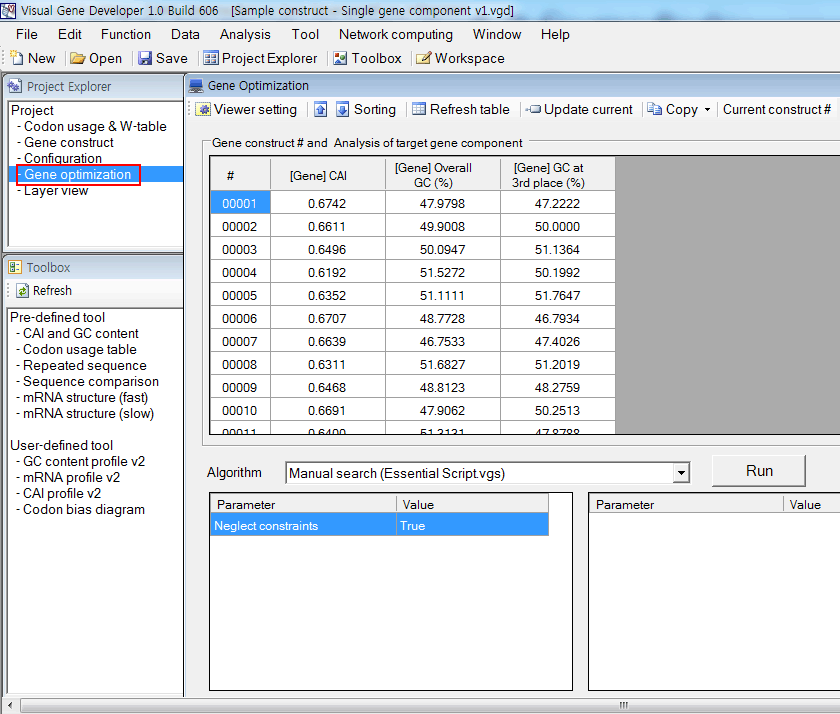
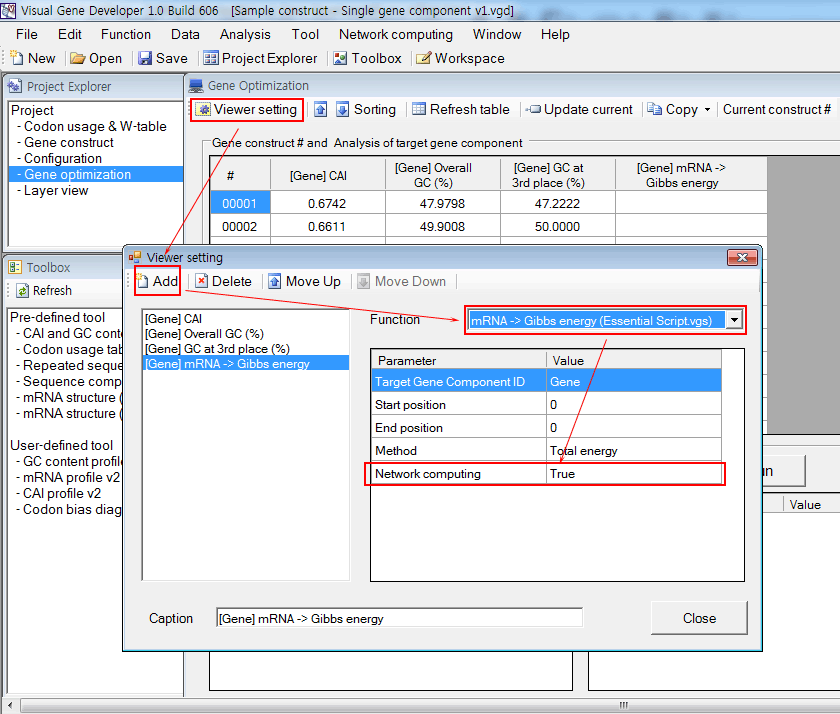
4. Set up the 'Gene Optimization' table. Add a new column titled '[Gene] mRNA Gibbs energy'. 'Network computing' option should be 'True' for Network & Multi-threaded computing.
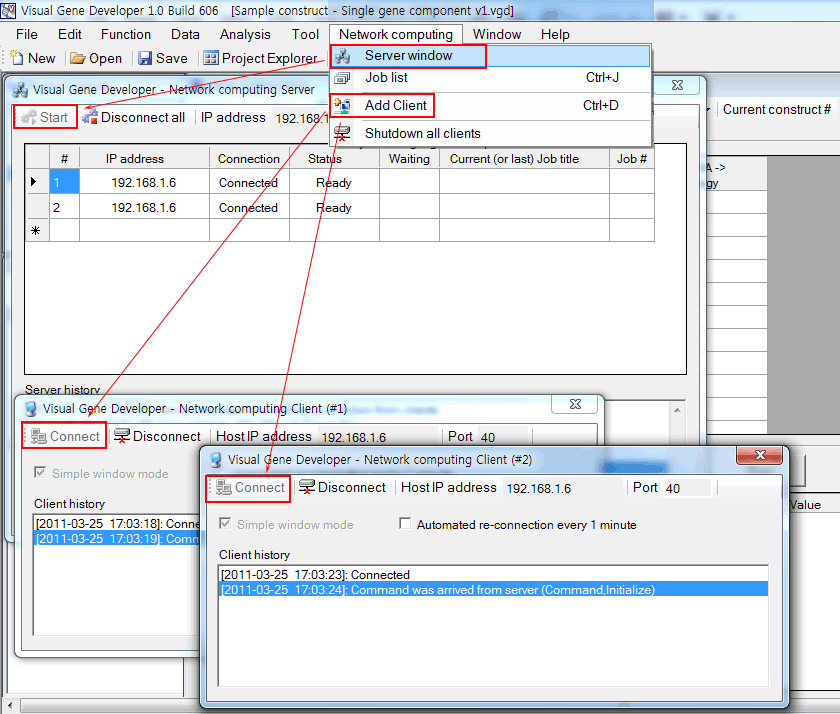
5. Set up a server and clients. You may add new clients on other computers. You can easily check the IP address of the host computer on the 'Visual Gene Developer - Network computing Server' window.
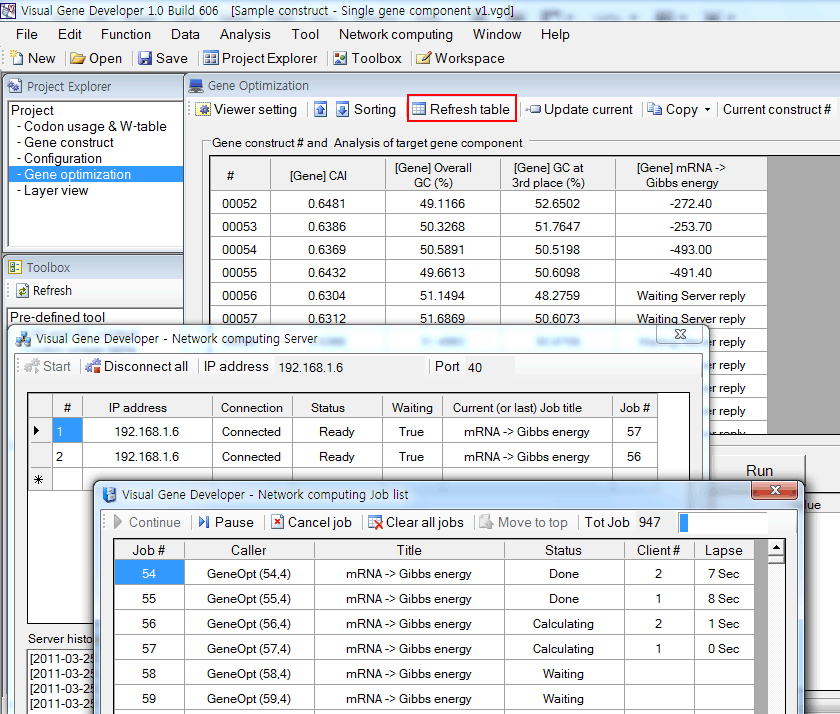
6. Click on the 'Refresh table' button on the 'Gene Optimization' window. The calculation of mRNA binding energy will be performed.
You can monitor its status on the 'Server' window or 'Job list' window.
7. Optionally, you can export the sequences and analysis results to the clipboard.